Motivation
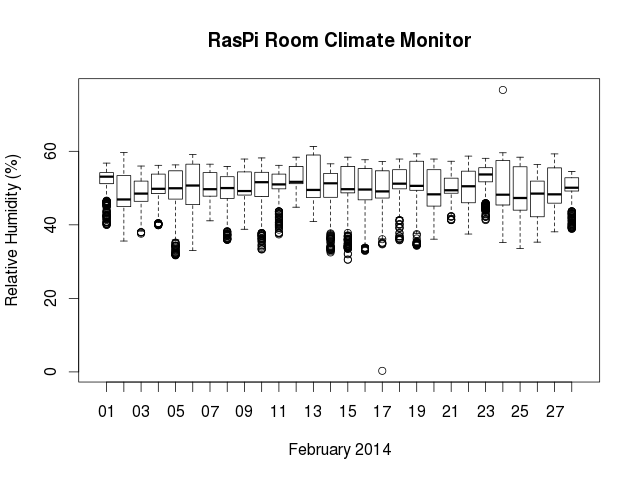
As discussed before, data of the sensors attached to my RasPi are stored in a MySQL database. I wrote some bash scripts to produce graphs using GNUplot which are presented as a gallery. After collecting data for a couple of weeks, I wanted to apply some statistics on the data to obtain a quick overview, i.e. to produce a whiskers or boxplot. Therefore, I decided to use R for this purpose.
 Data retrieval from MySQL database
My RasPi is running headless. In order to work with the data on an other machine it is necessary to export the desired subset from the database. Unfortunately, the INTO OUTFILE statement of MySQL doesn’t allow to choose a remote server for saving a CSV file. Therefore, one has to redirect the SQL output into a file. For replacing the tabstops with a different separator, one can pipe the SQL output through sed:
mysql -h servername -u username --password=secret -e "SELECT * FROM table where FROM_UNIXTIME(timestamp) >=NOW() - INTERVAL 7 DAY;" | sed 's/\t/;/g;s/\n//g' > week.csv
As a result a CSV file is generated containing a subset of observations from last 7 days.
date;time;timestamp;tmp1;hum;tmp2;bar;alt;light;tmp3
2014-02-22;13:13:00;1393074780;20.3;47.4;21.4;1004.64;71.51;117.9;9.1
2014-02-22;13:14:00;1393074840;20.3;47.5;21.4;1004.73;70.84;119.8;9.1
2014-02-22;13:15:00;1393074900;20.3;47.4;21.4;1004.82;70.93;117.6;8.9
2014-02-22;13:16:00;1393074960;20.3;47.6;21.4;1004.7;71.68;117.8;9
2014-02-22;13:17:00;1393075020;20.3;47.5;21.4;1004.73;72.18;121.5;9
2014-02-22;13:18:00;1393075080;20.3;47.5;21.4;1004.69;71.68;126.3;9
2014-02-22;13:19:00;1393075140;20.3;47.7;21.4;1004.69;72.02;125.6;9.1
2014-02-22;13:20:00;1393075200;20.3;47.7;21.4;1004.67;70.93;123.4;9.1
2014-02-22;13:21:00;1393075260;20.3;47.7;21.4;1004.7;71.26;124.4;9.1
Remember that a header is included in the first row, containing the field names. In R, the CSV file can be imported as a dataframe, with:
dataframe <- read.csv("filename", sep=";", header=T, stringsAsFactors=F)
If your table doesn’t contain a header, set header=F and use the names() command to rename V1, V2, V3 …
names(dataframe) <- c("date","time","ts","temp1","hum1","temp2","bar","alt","lux","temp3")
Although one can create plots using the timestamp for the X-axis, I prefer a more human-readable format. Therefore, I convert the timestamp into ISO format:
dataframe$ts <- ISOdatetime(1970,1,1,0,0,0,tz="CET")+dataframe$ts
Instead of using a temporal CSV file, it is also possible to import data directly into R. This requires the RMySQL package, which can be installed with:
install.packages("RMySQL")
library(RMySQL)