To directly obtain data from a MySQL database, first create a new connection object:
mydb <- dbConnect(MySQL(), user='user', password='secret', dbname='db_name', host='host_name')
For retrieval of data, submit a query as above and fetch them into a dataframe.
df <- dbSendQuery(mydb, "SELECT * FROM table where FROM_UNIXTIME(timestamp) >=NOW() - INTERVAL 7 DAY;")
dataframe <- fetch(df, n= -1)
If you don’t want to fetch all observations, set “n” to the number of rows.
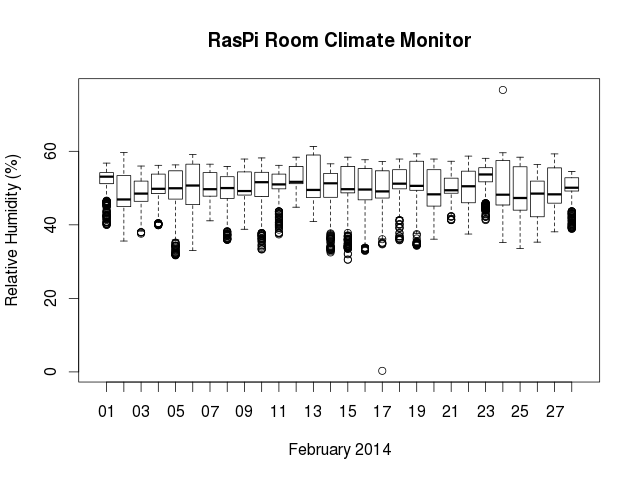
Plot sensor data using R
Once you’ve generated a dataframe object containing your SQL table data, you can do all kinds of statistics and mathematical operations. In RStudio, for a quick overview of my sensor data, I generate a boxplot with:
boxplot(hum ~ date,data=dataframe
Without RStudio, on can generate a boxplot.r containing the statements used above and execute them with ‘R –no-save < boxplot.r’
library(RMySQL)
mydb <- dbConnect(MySQL(), user='user', password='secret', dbname='db_name', host='host_name')
df <- dbSendQuery(mydb, "SELECT * FROM table WHERE FROM_UNIXTIME(timestamp) >= NOW() - INTERVAL 7 DAY")
data <- fetch(df, n = -1)
png('boxplot.png', width=640, height=480)
par(mar=c(7,5,1,1))
boxplot(hum ~ date, data = data, las = 2)
dev.off()
q()
This will output the plot as a png file. Other output formats, such as jpg, pdf, win.metafile and postscript are also available.