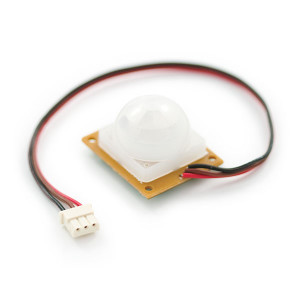
With a PIR sensor one can detect movements within it’s field of view and trigger other hardware, such as surveillance cameras. It is also possible to record the frequency of movements over time, e.g. to monitor motion activity in a room of your apartment.
 With a PIR sensor attached to my RasPi, I recorded motion events by storing UNIX timestamps in a single-column MySQL table. I wanted to visuaize these data points as a histogram displaying the frequency of motion events over time, but this task turned out to be more complicated than expected using GNUPlot. So here’s a short tutorial how it works:
GNUPlot is a powerful tool for graphical data analysis and to visualize mathematical functions and data interactively. Data can be read from simple ASCII files. Therefore, the first step of generating a histogram using GNUPlot is to export the desired data-set from the SQL database:
mysql -uuser -ppassword -Ddatabase -B -e "SELECT * FROM table WHERE FROM_UNIXTIME(timestamp) >= NOW() - INTERVAL 25 HOUR INTO OUTFILE '/tmp/data.csv' FIELDS TERMINATED BY ';' LINES TERMINATED BY '\n'"
On a default Raspbian installation, data must be exported into the /tmp directory. Due to file permissions other directories won’t work. After export, the data.csv file should look like this:
1420371620
1420371728
1420371831
1420372179
1420372196
1420372212
1420372223
1420372233
The method for generating a histogram displaying the frequency of events from a single column of time points is called binning and can be found on p. 90 of the GNUPlot documentation: “The frequency option makes the data monotonic in x; points with the same x-value are replaced by a single point having the summed y-values. To plot a histogram of the number of data values in equal size bins, set the y-value to 1.0 so that the sum is a count of occurances in that bin.” In the bash-script below, I used the expression:
binwidth = 1800
bin(x,width) = width*floor(x/width)
The script counts the number of time-records with in a defined intervall of 1800 seconds (binwith of 15 minutes), which will be represented on the Y-axis. In order to correctly label the x-axis, the UNIX epoch date must be set to the proper value (see my comments in the bash-script).