#!/bin/bash
# Remove old temporal file
if [ -f /tmp/24hours.csv ]
then
 rm -rf /tmp/24hours.csv
fi
# Query SQL Database and generate a temporal CSV file containing sensor data from the last 24 hours
sudo nice -15 mysql -uuser -ppassword -Ddatabase -B -e "SELECT * FROM table WHERE FROM_UNIXTIME(timestamp) >= NOW() - INTERVAL 25 HOUR INTO OUTFILE '/tmp/data.csv' FIELDS TERMINATED BY
';' LINES TERMINATED BY '\n'"
# Define title of the plot and print last date of plotting
TITLE="Motion Sensor until `date +{c7f7cb1468c0d02af358b3ce02b96b7aadc0ce32ccb53258bc8958c0e25c05c4}F\ {c7f7cb1468c0d02af358b3ce02b96b7aadc0ce32ccb53258bc8958c0e25c05c4}T`"
# To correct UNIX epoch date and gnuplot epoch date, we have to substract $EPOCH_OFFSET
EPOCH_OFFSET=946684800
# Get UNIX epoch date
TODAY="`date +{c7f7cb1468c0d02af358b3ce02b96b7aadc0ce32ccb53258bc8958c0e25c05c4}s`"
# Correct offset to 2000-01-01 00:00:00
TODAY=$(expr $TODAY - $EPOCH_OFFSET)
# We want to plot values from 24 h
YESTERDAY="`date +{c7f7cb1468c0d02af358b3ce02b96b7aadc0ce32ccb53258bc8958c0e25c05c4}s --date="-1 day"`"
# Correct offset to 2000-01-01 00:00:00
YESTERDAY=$(expr $YESTERDAY - $EPOCH_OFFSET)
nice -15 /usr/bin/gnuplot << EOF
# Data file uses semikolon as a separator
set datafile separator ';'
# Title of the plot
set title "$TITLE"
# We want a grid
set grid
# Ignore missing values
set datafile missing "\N"
# X-axis label
set xlabel "Date/Time (CET)"
# set X-axis range to current date only
set xrange ["$YESTERDAY":"$TODAY"]
# Title for Y-axis
set ylabel "Activity / 30 min"
# Define that data on X-axis should be interpreted as time
set xdata time
# Time in log-file is given in Unix format
set timefmt "{c7f7cb1468c0d02af358b3ce02b96b7aadc0ce32ccb53258bc8958c0e25c05c4}s"
# Display notation for time
set format x "{c7f7cb1468c0d02af358b3ce02b96b7aadc0ce32ccb53258bc8958c0e25c05c4}d.{c7f7cb1468c0d02af358b3ce02b96b7aadc0ce32ccb53258bc8958c0e25c05c4}m\n{c7f7cb1468c0d02af358b3ce02b96b7aadc0ce32ccb53258bc8958c0e25c05c4}R" # Display time in 24 hour notation on the X axis
# Set time intervals for binning
binwidth = 1800 #3600 seconds in an hour
bin(x,width) = width*floor(x/width)
# generate a legend which is placed underneath the plot
#set key outside bottom center box title "Motion Sensor Data"
# output into png file
set terminal png large
set output "/var/www/plot.png"
# read data from file and generate plot
plot "/tmp/data.csv" using (bin(\$1,binwidth)):(1.0) title "" smooth freq with boxes
# end of script
EOF
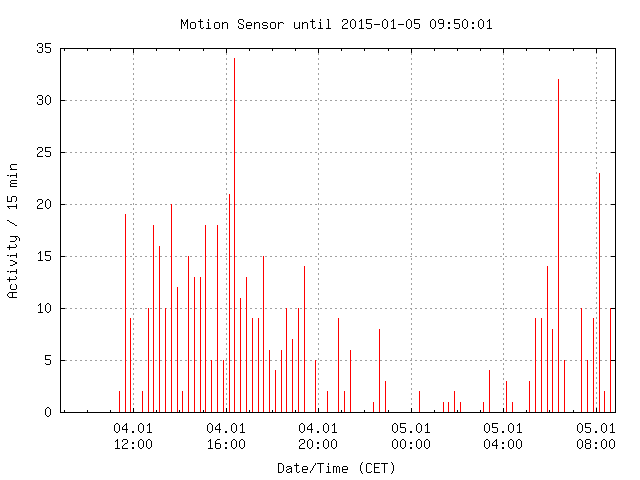
The script should generate histograms as shown below. If you want to present the histogram on a web-page, simply add the script to your crontab to keep it up-to-date.