How to interpret the results
Monitoring indoor humidity helps to prevent from mold on your walls. However, you shouldn’t be alarmed if the humidity in your room is above 60 {c7f7cb1468c0d02af358b3ce02b96b7aadc0ce32ccb53258bc8958c0e25c05c4}. The relative humidity in your room or apartment depends both on your activities, like cooking or showering and current weather conditions. What matters is that you shouldn’t give it a chance to condense on a cold surface, i.e. the outer walls of your room. Condensation on a surface takes place, if its temperature drops below the dew point of the air in the room. Thus, from the collected data you should calculate the dew point and compare it with the temperature on your outer walls. Therefore, you should check their temperature at different spots using an infrared thermometer, especially at those places were you observed mold. In the GNUplot turorial I have implemented an equation to calculate and plot the dewpoint from the collected data (purple line on the plot).

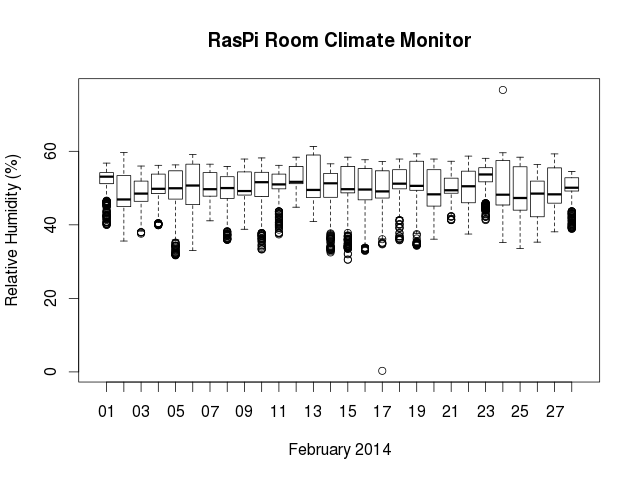
For a general insight into the collected data, you can do a quick evaluation by generating box- or whiskers plots, i.e. for a complete month as demonstrated below.
 If you find spots on your walls with a temperature lower than dew point, you should take care about changeing your habits i.e. proper heating and ventilation at regular intervals. Perhaps you should consider a better insulation for your house.
In case that you observe mold on walls with a surface temperature above the dew point, you should check the cladding of your house and repair all cracks in the walls to avoid intrusion of rain water.